Testing your CASA installation
This page will help you test your CASA installation. Please follow the instructions before arriving at ERIS26 so that we don't need to resolve installation issues.
Test all CASA functionality
In the first part, we shall ensure that all the components of CASA are working properly.
- To begin, create a directory called something like ERIS2026 in a location with at least ~10GB of disk space. Do not run CASA or work within your CASA installation.
- If you haven't already, download the calibration tutorial to this folder using the following link:
or enter the following in the command line / Terminal to download these data,
wget https://www.jb.man.ac.uk/ERIS26/data/ERIS26_calibration_tutorial.tar.gz - On the command line, ensure you are in the same folder as the
ERIS26_calibration_tutorial.tar.gzfile, then extract the contents by doing,tar -zxvf ERIS26_calibration_tutorial.tar.gz - This should create a folder called
ERIS26_calibration. You should change directory into it (cd ERIS26_calibration). - Start CASA. Depending on your installation, this may have different routes.
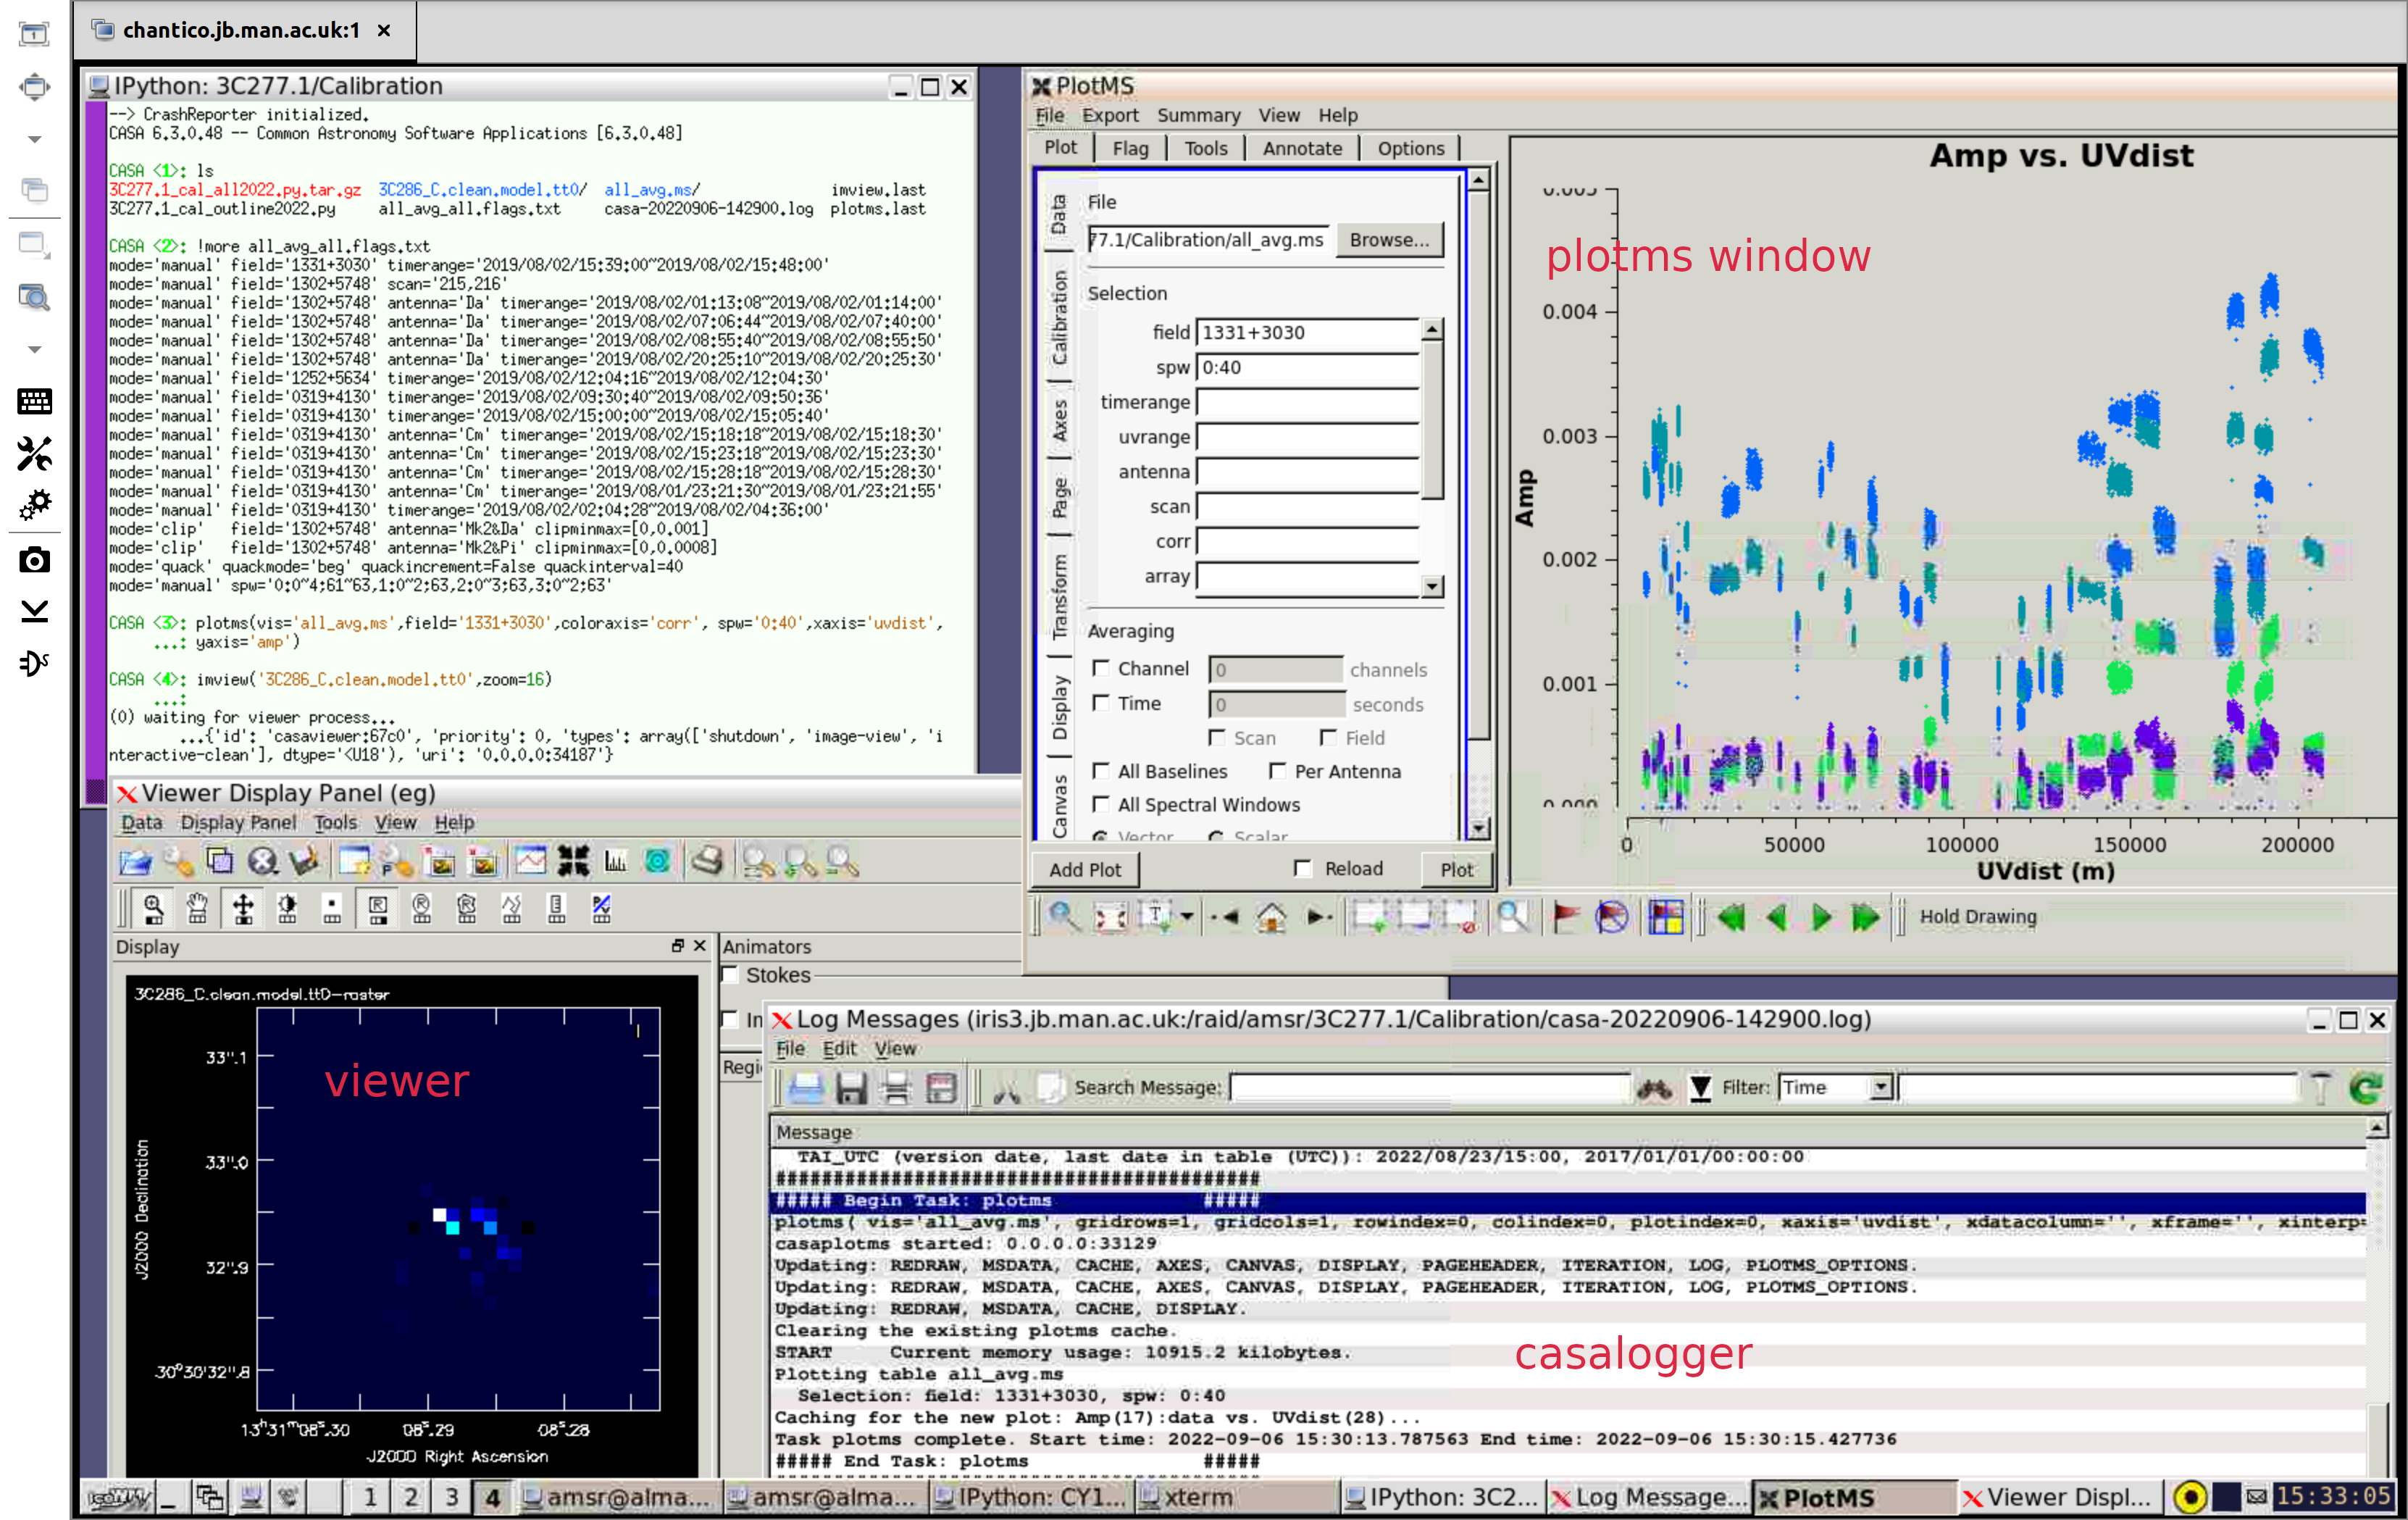
- You should see a logger appear, as in the Figure below, bottom right. Whenever you are running a CASA task, always check the logger messages. These are saved as
casa-<timestamp>.log, e.g.,casa-20260713-091726.log. - You can use simple shell commands in CASA, e.g., type
ls, or more complex commands prefixed with!, e.g.,
(see the Terminal in the top-left of the Figure below)!more all_avg_all.flags.txt - Test that the displays are working by entering,
Note: If entering all the parameters for a task at once, either like this or in a script, separate them with commas.plotms(vis='all_avg.ms', field='1331+3030', coloraxis='corr', spw='0:40', xaxis='uvdist', yaxis='amp') - This should produce the display shown in the top-right of the figure below.
For Linux users only:
- Try opening the viewer GUI with the following command,
imview('3C286_C.clean.model.tt0', zoom=16) - This should produce the display shown in the lower-left corner of the Figure below. The exact colours and panel layout may differ, but if you don't have the casalogger and the plotms and viewer windows at all, or if they are unreadable, consult the CASA debugging pages or your sysadmin.
For Mac users only:
-
In a new terminal tab/window, run the following command to open CARTA (if you have set the alias correctly)
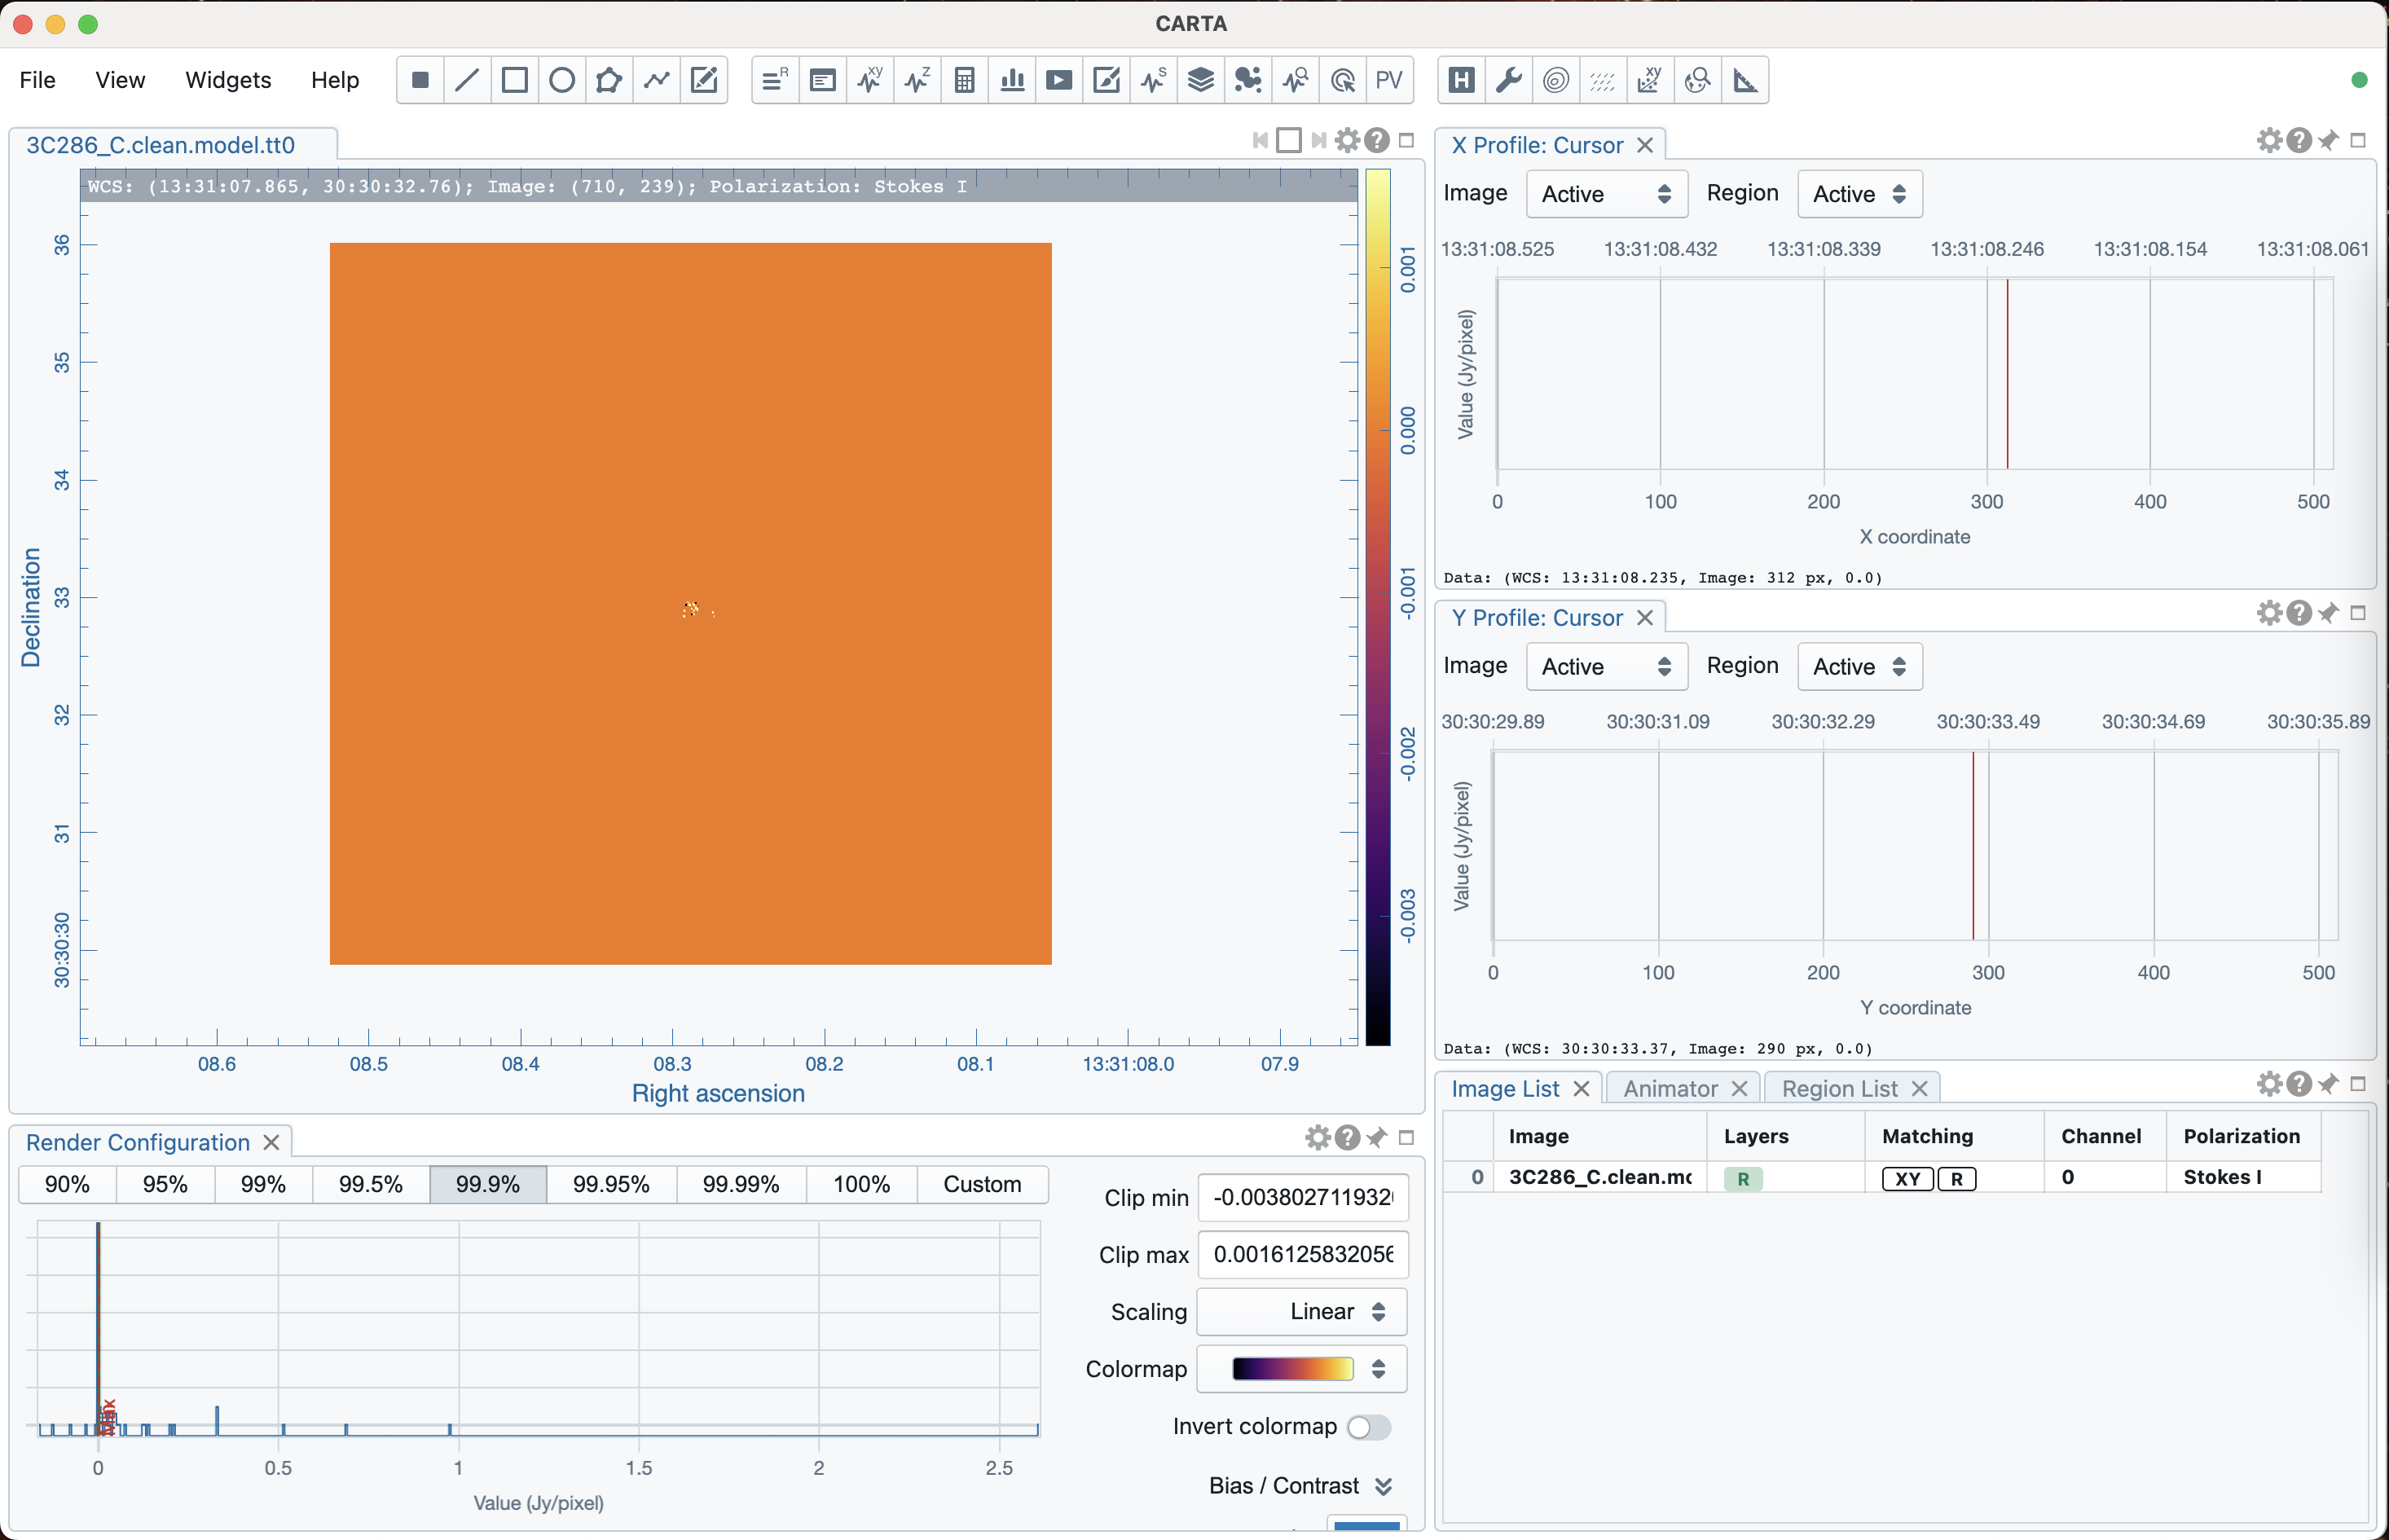
carta; otherwise, open the CARTA Application. Open3C286_C.clean.model.tt0(which is located in the ERIS26_calibration folder). You should see a window appear that is similar to the one shown in the left-hand panel of the Figure below.
-
Next, we wish to test the casagui, which is used for interactive cleaning. Return to your CASA prompt/terminal and copy the following commands.
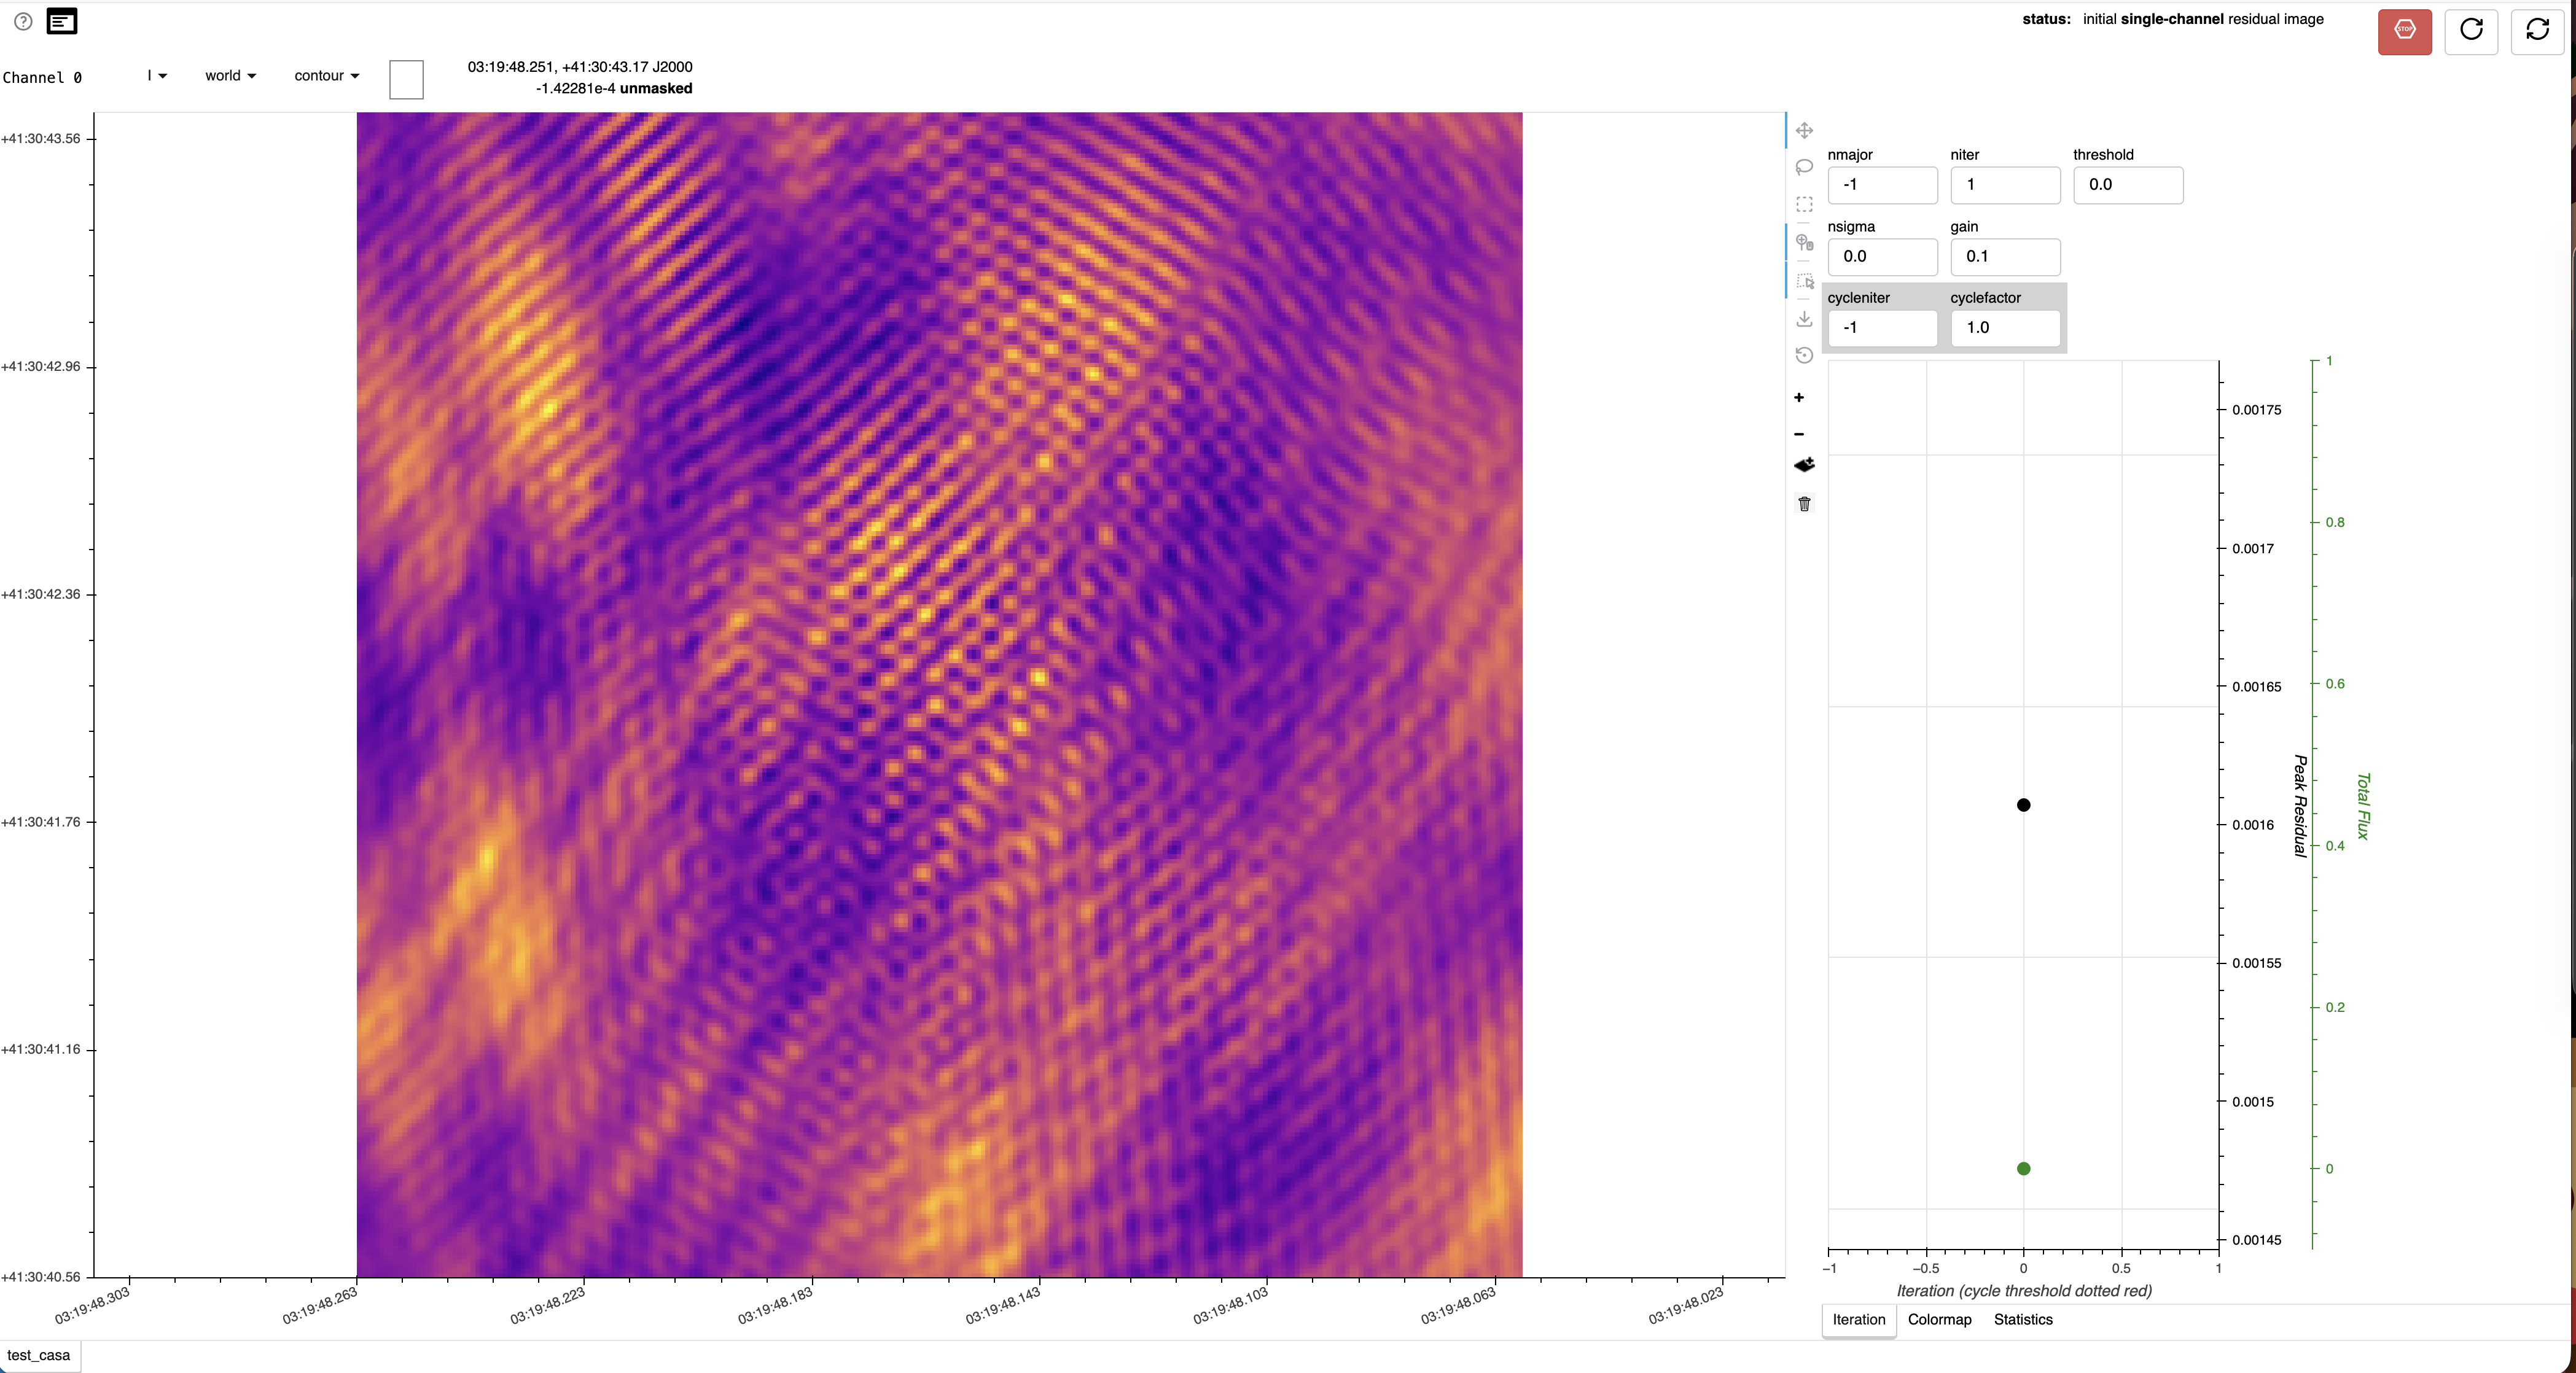
iclean(vis='all_avg.ms', imagename='test_casa', spw='0', specmode='mfs', niter=1, cell='0.012arcsec', imsize=[256,256], field='0319+4130') - If it works properly, you should have a web browser open with a tab that looks like the figure below.
- Left-click the box-select tool, drag a box across the image, and press
ato make it a region (as shown in the green box below). - Press the circular arrow to verify that cleaning is working properly. The status should read 'Reached global stopping threshold (within mask).'
- Click the stop sign to stop the deconvolution.
Checking CASA parameters
In this section, we shall inspect the CASA prompt and explain how to enter parameters into CASA tasks. This is vital for the upcoming tutorials. Please follow the instructions below.
- In the CASA terminal, enter
tget plotms. This restores the last time you ran the task. - Enter the command
inpto display the inputs for that task. Note that you may need to scroll up to see all the parameters. You should see that all parameters are set to defaults or valid values in blue (as shown on the left side of the figure below). - Enter as separate lines the following,
gridrows='1'
xaxis='uvdistance'
inp plotms
These values are shown in red (on the left of the figure below) to indicate errors:
gridrowsshould be a integer like1, not a string like'1'xaxisis a string, but the allowed values do not include'uvdistance', only the abbreviation'uvdist'
- If you re-enter the correct values and enter
inpagain, they should turn blue again. NB. If entering each parameter manually or separately in the CASA terminal, don't add a comma at the end of the lines. - Once the inputs are correct, you can run the task manually by typing its name, e.g. plotms. In the tutorial, you will see alternative ways to run the tasks, such as from a script.
Finally, if you need more information on any task, type e.g.,
help plotms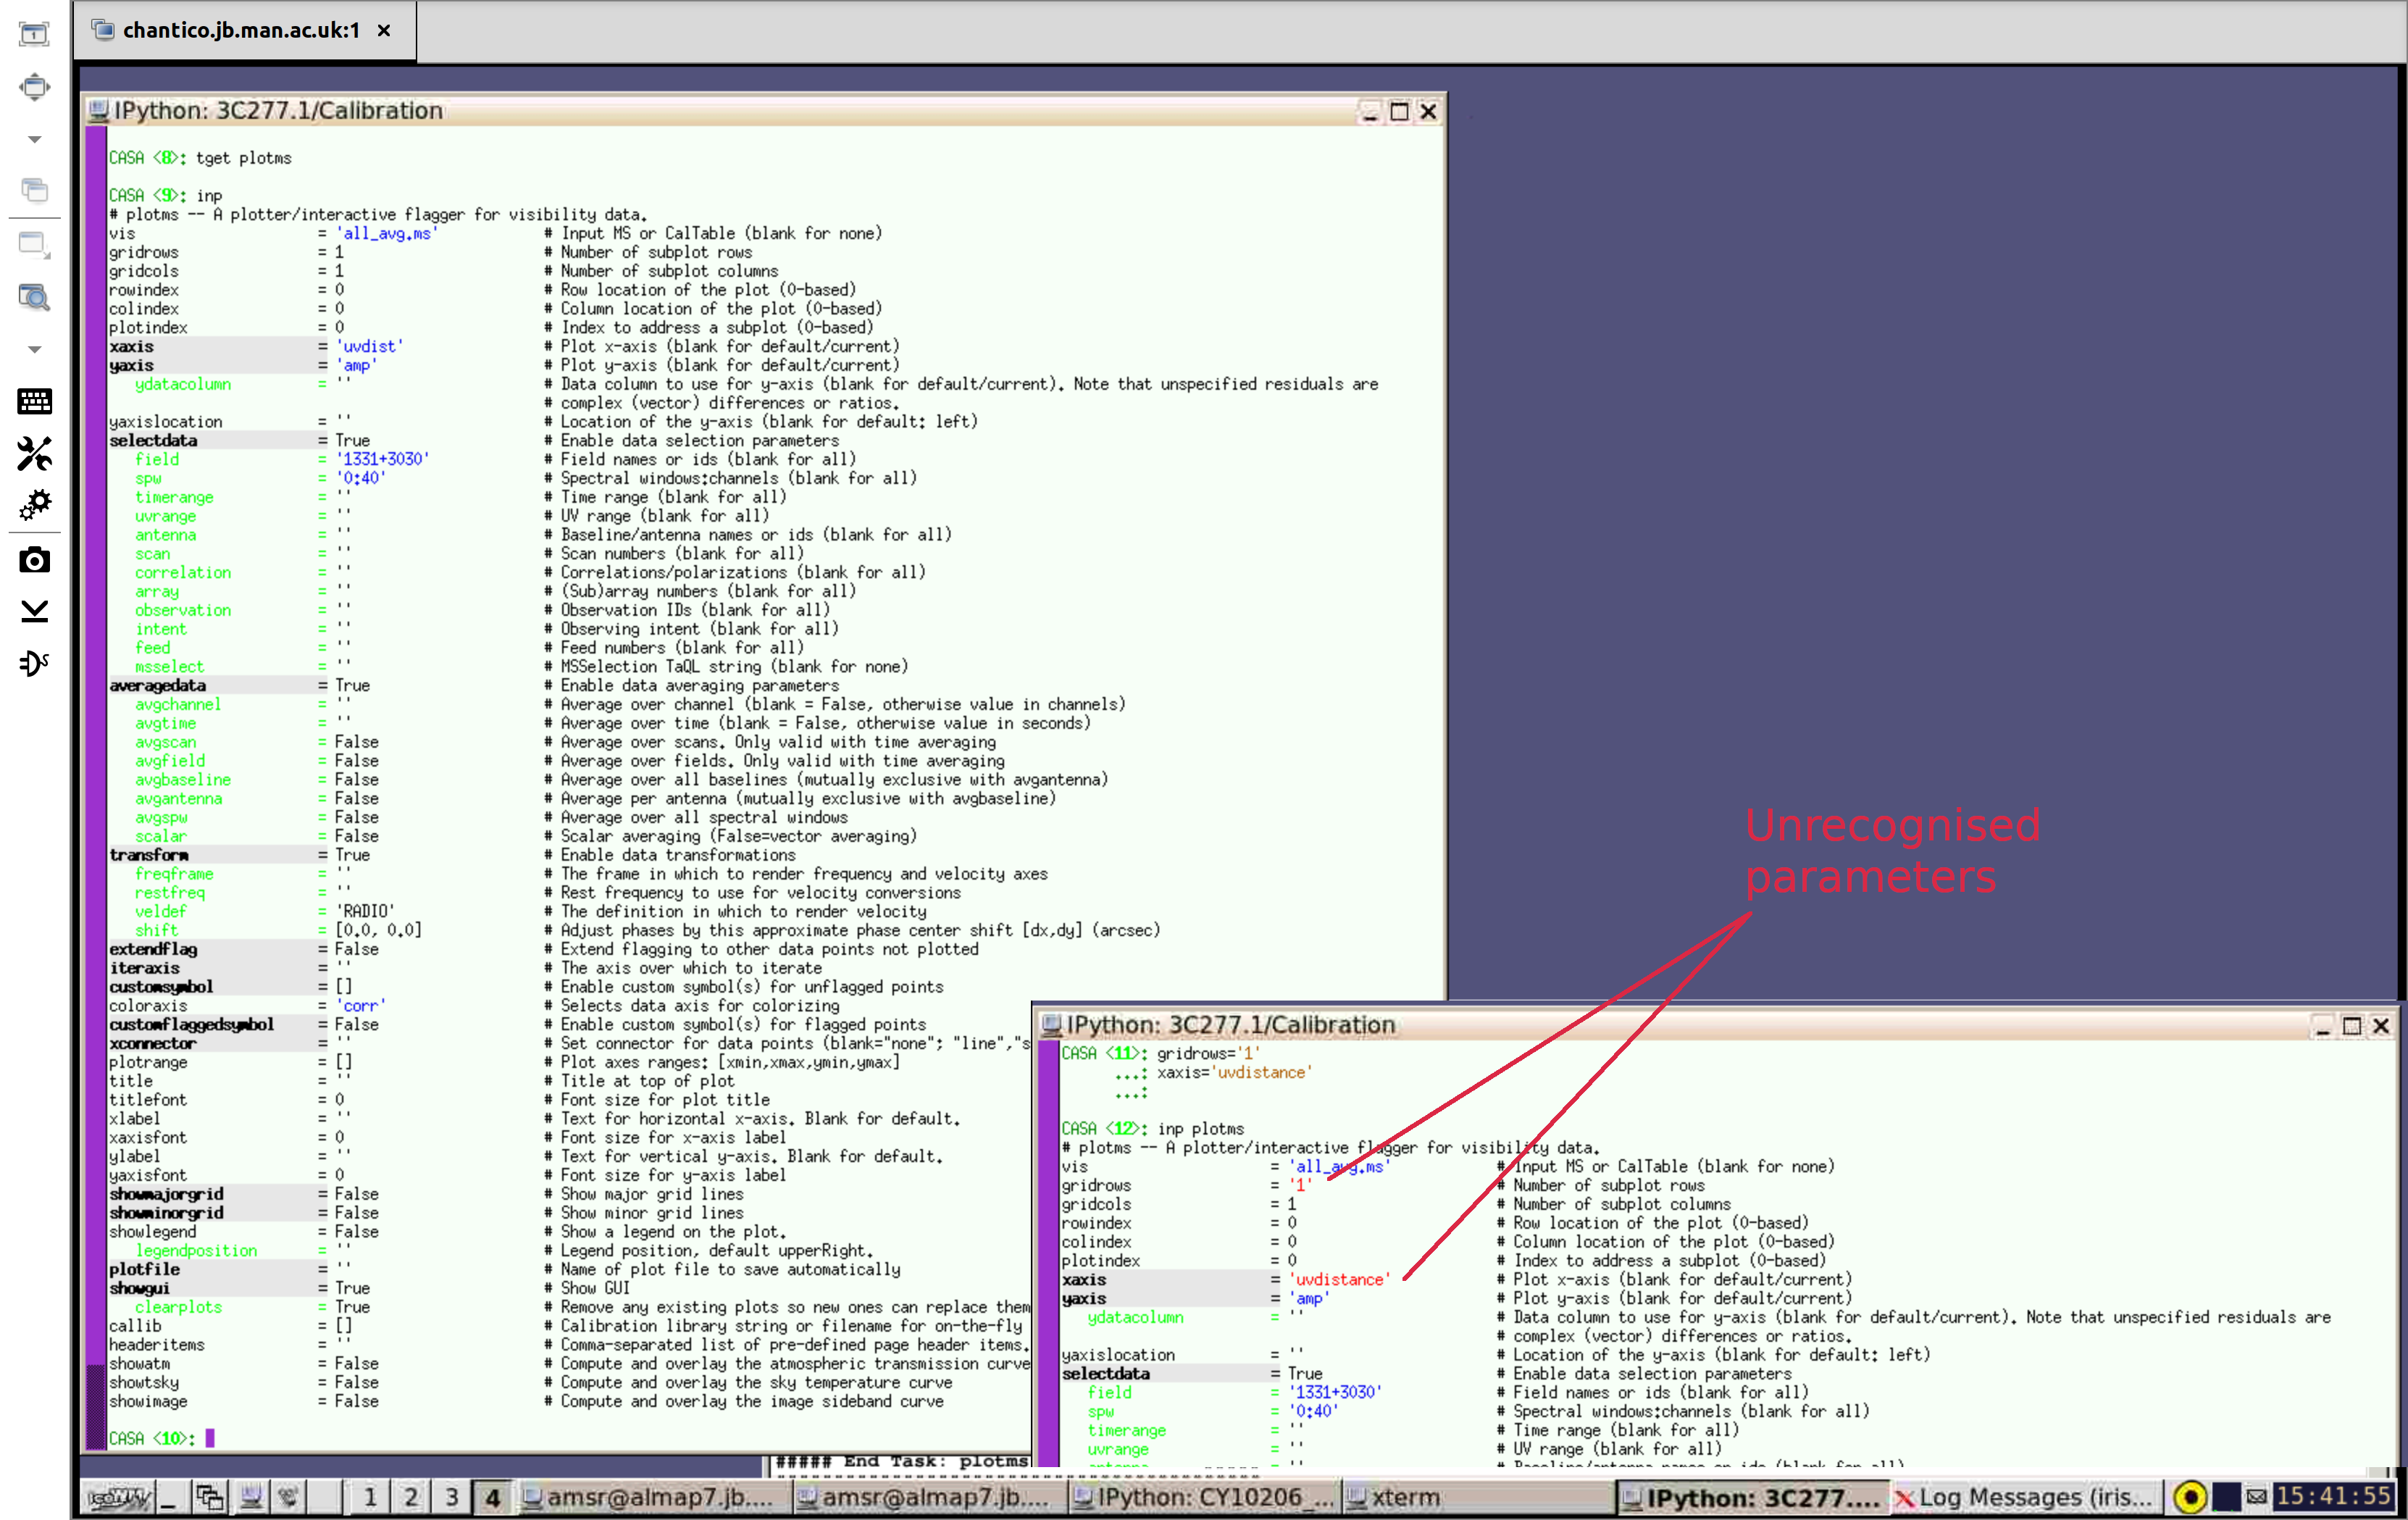
With this complete, you are ready to start the tutorials. Use the link below to return back to the homepage.